Data Cubes Insights
UX research readout for Nike EMEA analytics platform

The Problem
Nike EMEA's data cubes — the analytical tools used by merchandisers, planners, and analysts to make critical business decisions — were plagued by performance, reliability, and usability issues. Nearly half of users reported poor performance, and a fifth experienced Excel crashes during normal use. The analytics team needed structured research to understand the scope and prioritize fixes.
Process
Conducted comprehensive UX research across 10+ user roles within the EMEA supply chain organization. The research captured:
- Employee background and role context — How each role interacts with the data cube ecosystem
- Usage patterns — What they use the cubes for, how frequently, and on what devices
- Information sharing — How insights from cubes flow through the organization
- Pain points — Structured capture of performance, reliability, access, and usability issues
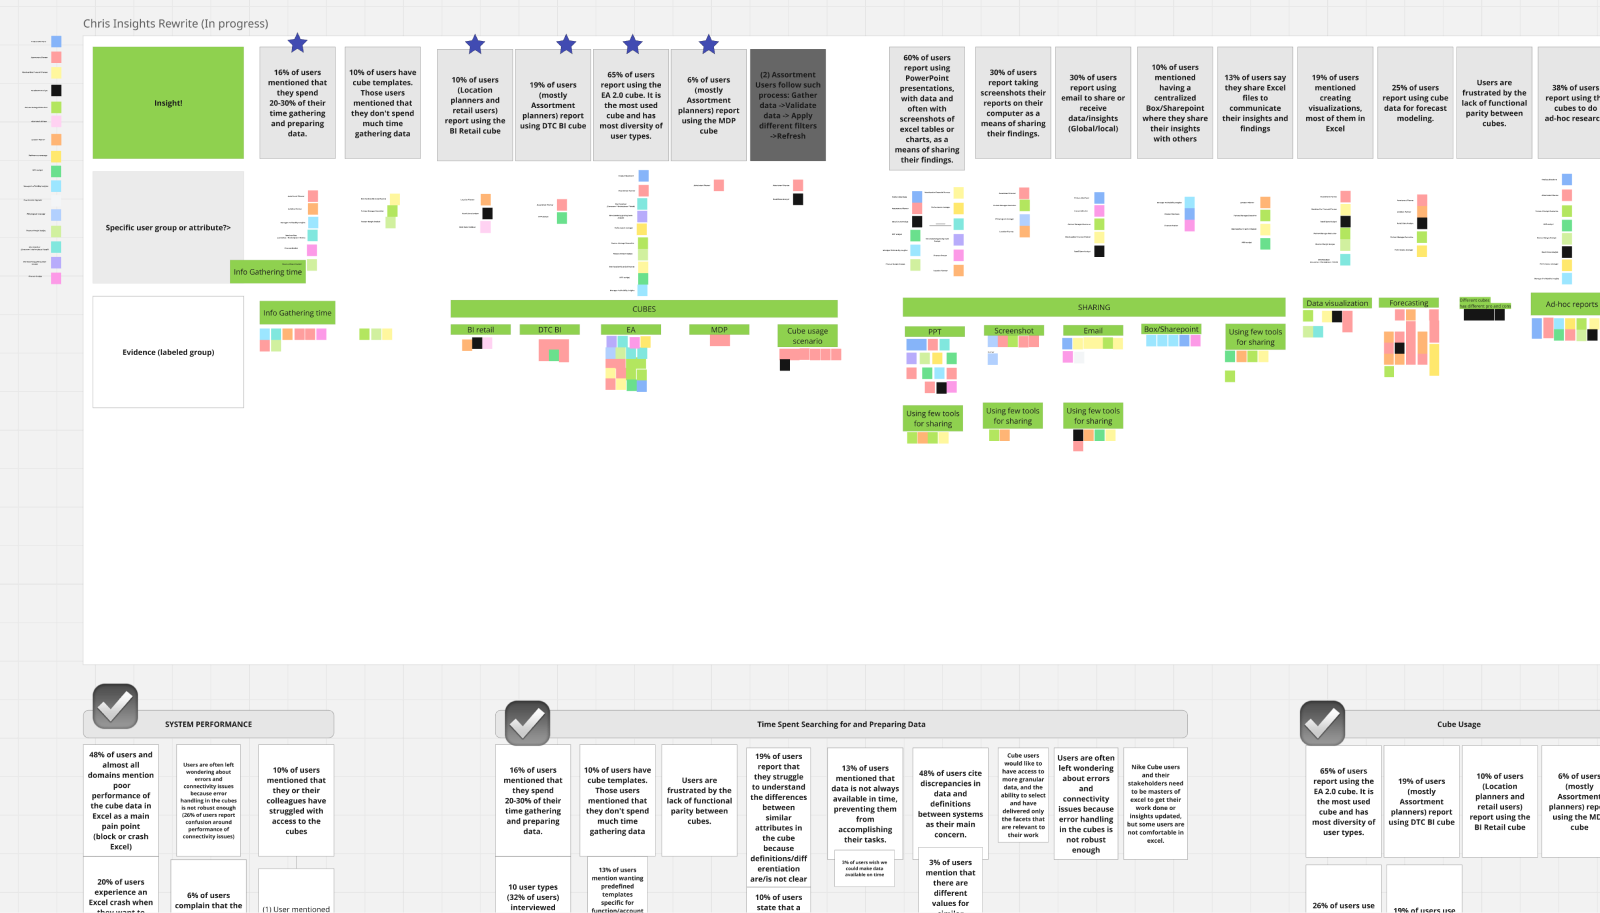
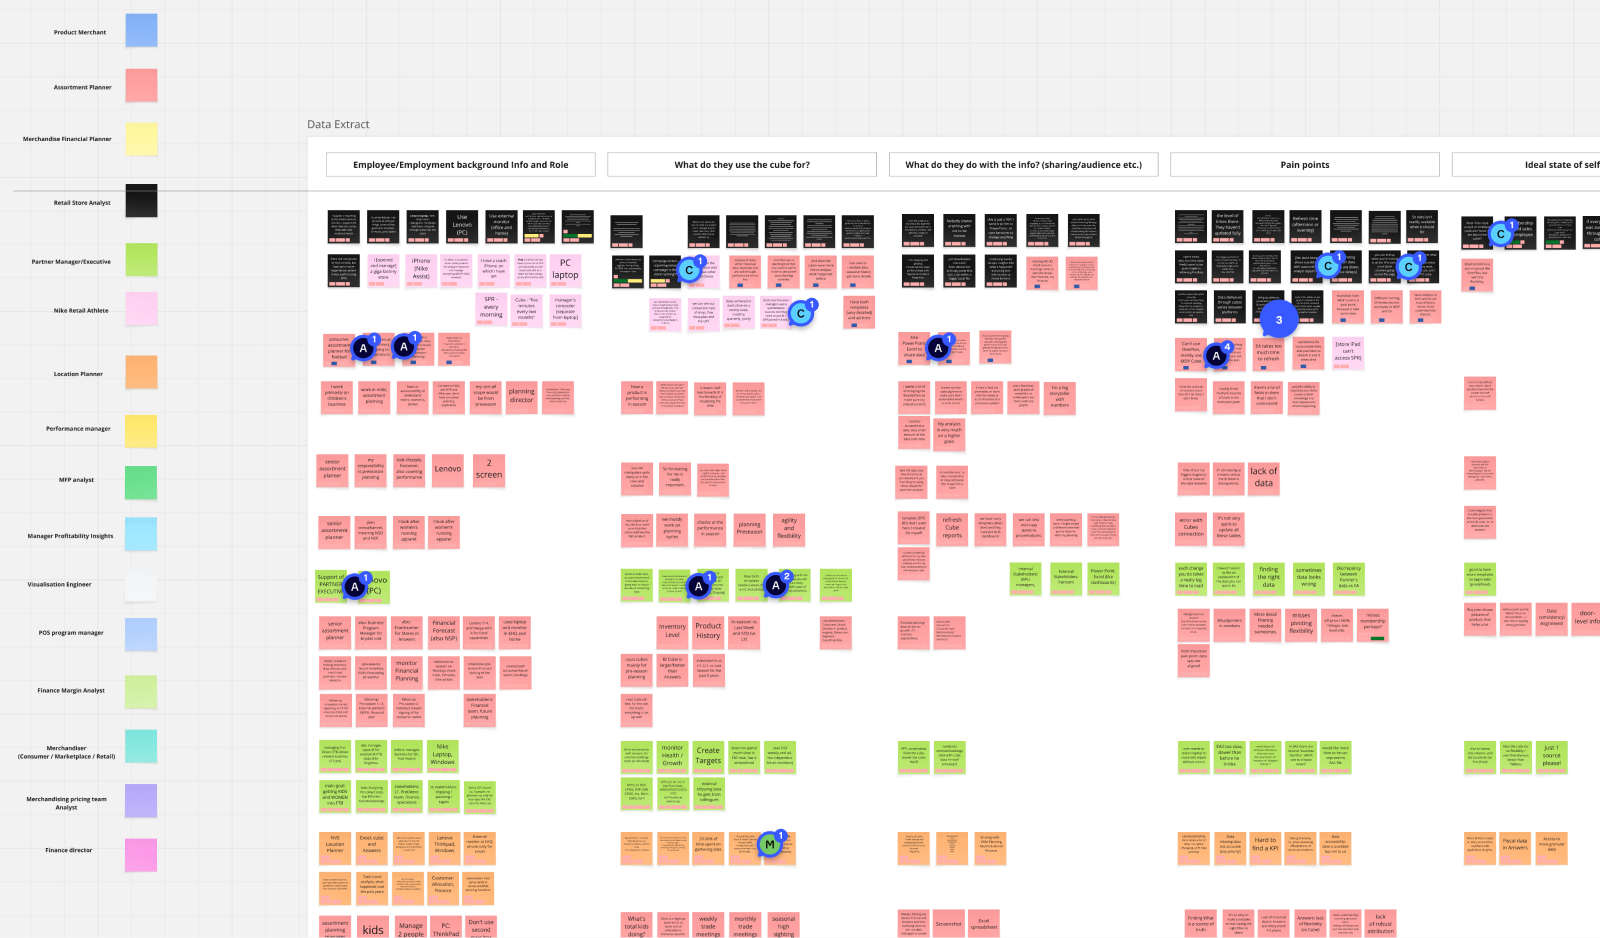
Synthesized findings through large-scale data affinity boards, organizing hundreds of data points by role and theme. Generated actionable insights around performance (48% poor performance, 10% Lenovo PC issues), reliability (6% connection loss), and time waste.
Solution
A comprehensive research readout presentation delivered to EMEA I&A leadership, providing data-driven justification for infrastructure investment and UX improvements. The research quantified the business impact of poor tooling (time wasted, workarounds, shadow-IT) and provided a prioritized improvement roadmap.
Key Deliverables
- Research readout deck with data visualizations
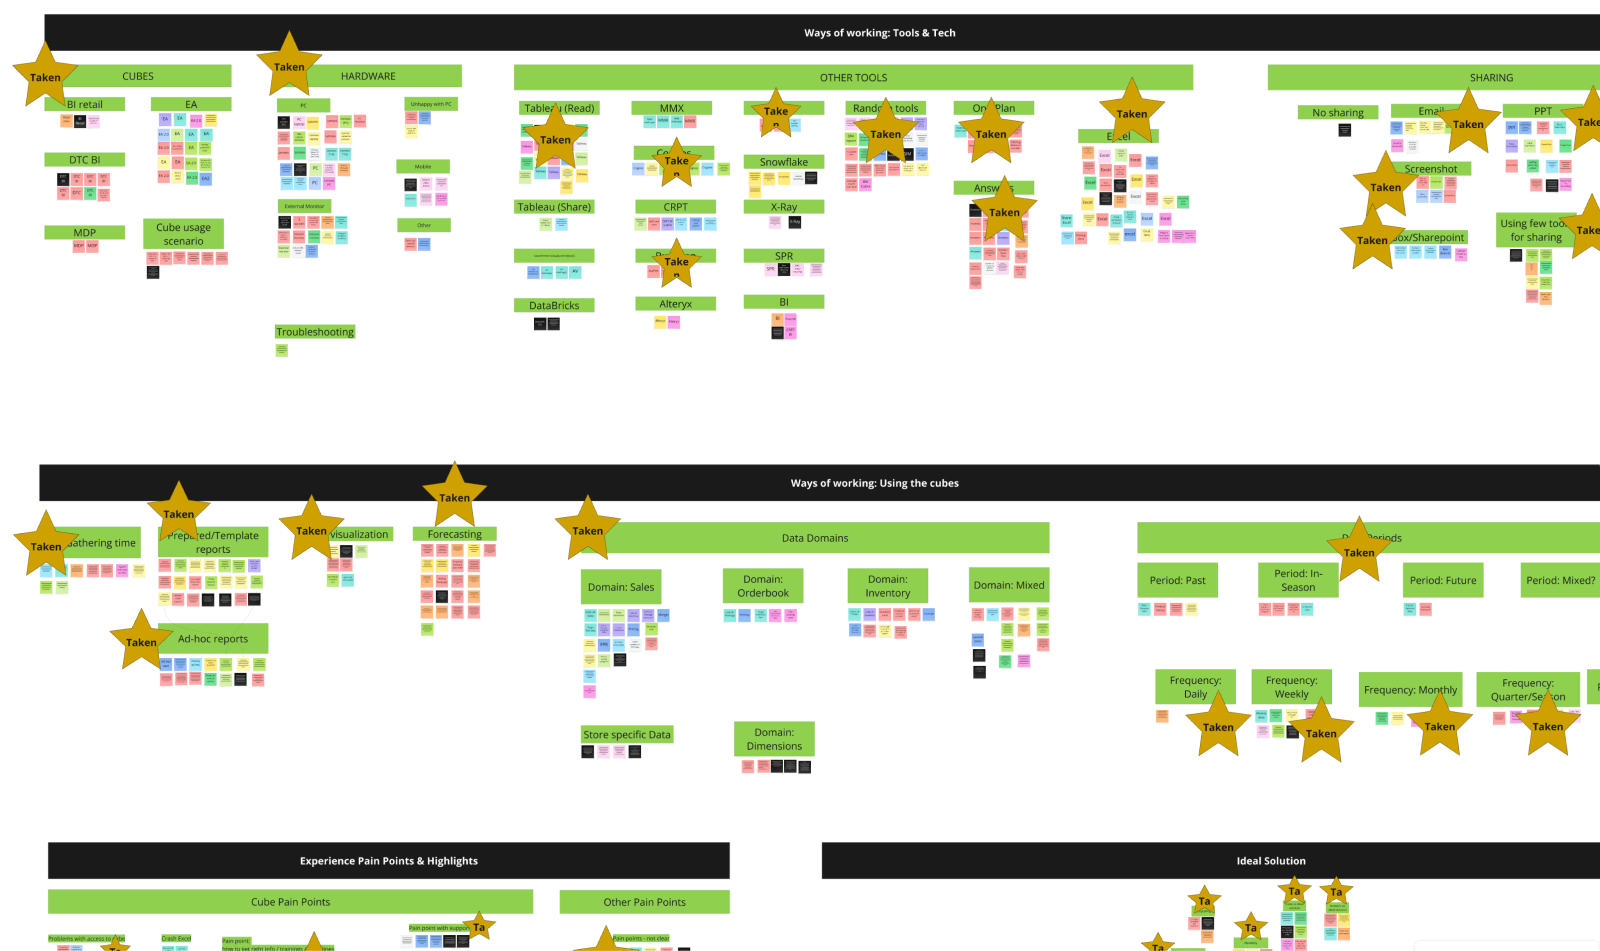
- Data synthesis boards (role x theme affinity mapping)
- Performance, reliability, and audience/usage insight pages
- Quantified pain point analysis with severity metrics
- Insights generation framework for ongoing research
Design Gallery